Session 9- Data export and simplification#
Goal: Learn how to get your data out of QuPath and into a manuscript
YouTube video walkthrough: Session 9
1. Exporting Cell Counts#
Make sure you have a project in which you successfully ran the multiplex classifier on all 3 lung images. If you did not complete this, open “Proj1 - Session 9” from the backup projects folder.
Save your current image
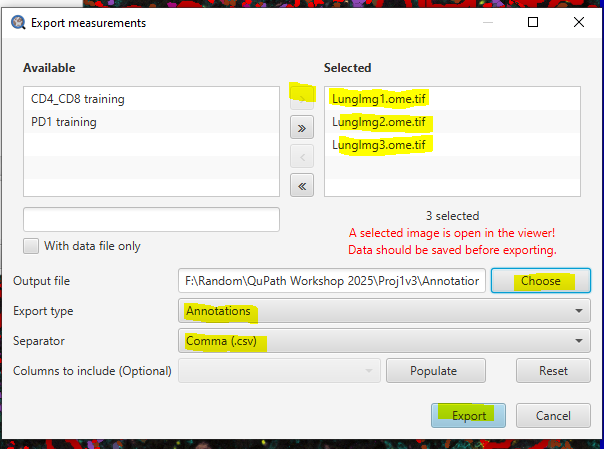
File > Save. Data export will not work properly without saving first!Measure > Export measurementsSelect the 3 finished images and click the carrot > to select them for export
You’ll likely get a red warning message reminding you to save. It’s OK, it’s always there - but is a valid warning since a fresh cell detection, or any changes you make to the current image before saving, will not be represented in your exported data.
Click Choose next to “Output file”. Give the new file the name “Annotations Measurements”
In the dropdown, choose Export type = “Annotations”
Choose the file separator you want. In the US, “comma (.csv)” is standard.
Click Export. The export should take <<1 min. This produces a spreadsheet with 1 row per annotation (full tissue region and tumor) in each image. Each row contains the information you see in the Annotation tab when you select an annotation.
Working with the annotation data in Excel#
Open the created .csv file in your spreadsheet program of choice (Excel, Google Sheets, Libre Office Calc, etc). I’m using Excel.
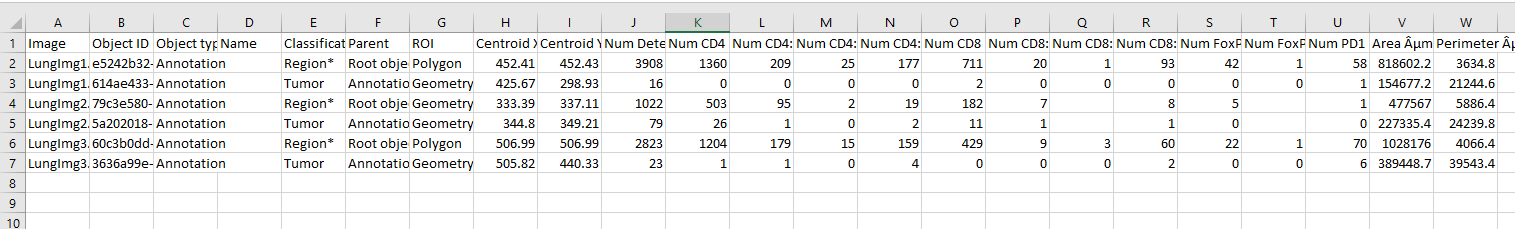
To simplify, delete the following columns:
Object ID
Object type
Name
Parent
ROI
Centroid X
Centroid Y
Perimeter
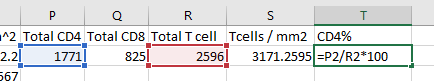
Create the following column headers:
Num CD4
Num CD8
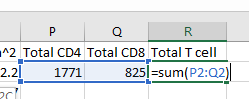
Num T cells
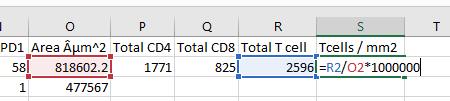
Tcell / mm2
CD4%
We’re going to calculate those metrics for all 6 annotations.
To calculate the total number of CD4 cells, you must add the cell counts in any category that says CD4 (CD4, CD4: FoxP3, CD4: FoxP3: PD1, CD4: PD1)

Repeat for CD8s

Add the CD4 and CD8 cell counts to find total T cells. (For the immunologists: relax, this is a simplification for example purposes.)
Divide the T cell count by the area to find T cell density: \(Num Tcells / Area (um^2) *1000000 = Tcells / mm^2\)
Calculate CD4% of all T cells as \(Num CD4 / Num Tcells * 100 = CD4\% \)
Select all of the newly calculated metrics and double click to drop down for all tissues
Similar procedures could be used to find the frequency of FoxP3s among CD4s or the frequency of PD1 among CD8s, etc.
Compare tissue types and sample by sorting the data by the Classification column to separate the full tissue and the tumor-only.
2. Exporting Individual Cell Measurements#
Sometimes, instead of needing the total fraction of positive cells in an area, we need the distribution of cell measurements.
Back in QuPath:
Measure > Export measurementsSelect the 3 finished images and click the carrot > to select them for export
Click Choose next to “Output file”. Give the new file the name “Cell Measurements”
In the dropdown, choose Export type = “Detections”
Choose the file separator you want. In the US, “comma (.csv)” is standard.
Click Populate. Then, in the dropdown, select:
Image
Classification
Each “mean intensity” measurement (8 total)
Click Export. The export should take <1 min (often more for large projects and full whole slide images). The output file will have 1 row per cell, with each row containing everything we have measured about that cell.
Working with the Cell data in Excel/Prism#
Open the created file in Excel
Filter the long spreadsheet for Lung1 and CD4+ cells
Create a new worksheet called “CD4 PD1”. Copy the values from the column “ROI: 0.33 µm per pixel: PD1: Mean” into the new worksheet.
Repeat for Lung2 and Lung3.
Select columns A, B, C.
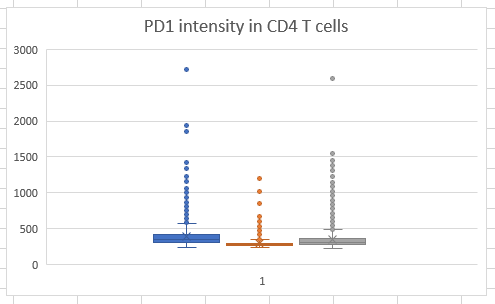
In the Insert tab, click the dropdown next to the blue bar graph and choose “Box and Whisker”
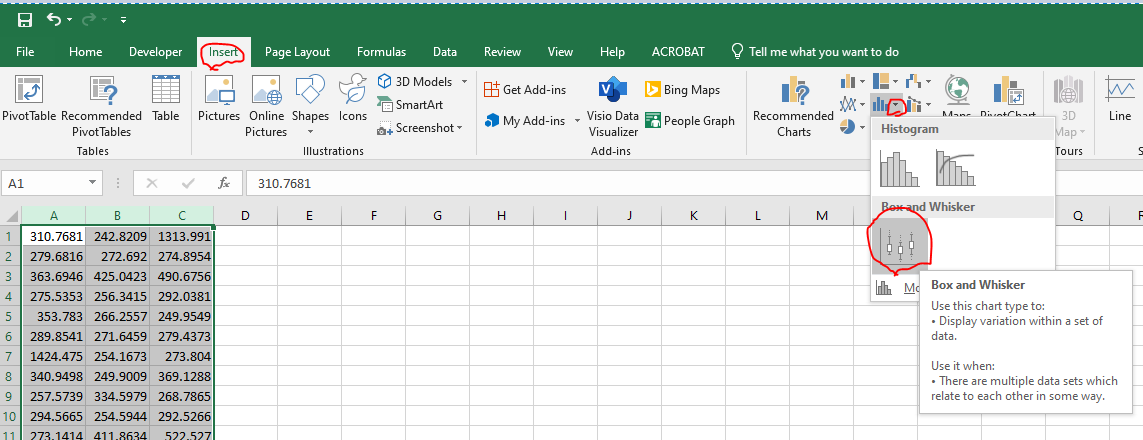
You’ll get a graph that looks like this:
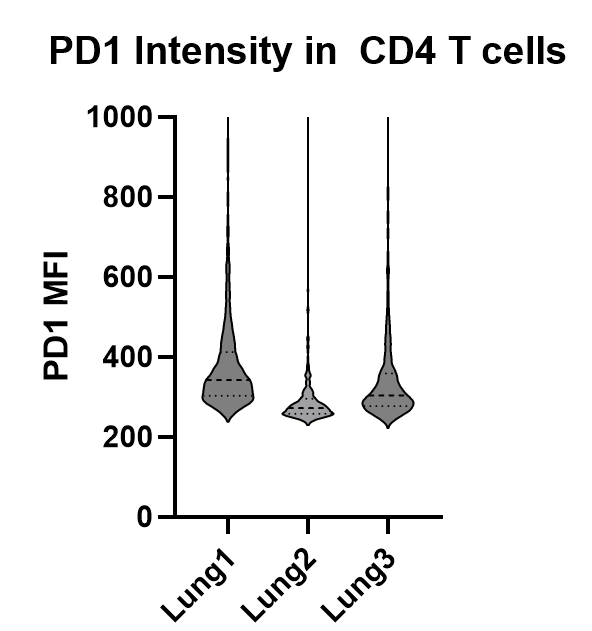
8. Alternatively, if you have access to Prism, paste the data directly into Prism instead of a separate worksheet (easier). The resulting violin plot will be prettier and will look like this:
A note on image analysis statistics#
When calculating statistics, it’s important to keep track of technical vs biological replicates
- 1 mouse/human sample = n of 1
- 10000 cells in a single section = 1 biological replicate
- 2 sections from the same mouse = 2 technical replicates
- Individual cells are NOT independent. Do not perform a t-test or ANOVA on them. If you try to, you will find that these 3 crops from the same lung are p<.0001 different from each other!
- To display both sample variabity and cell-to-cell variability, use Nested plots in Prism. For further information, see the informative and funny SuperPlots paper
It’s equally important to keep track of error propagation.
To WILDLY simplify power analysis, your classifier should have less error than both the difference between groups and the expected frequency of cells. Which one is more limiting depends on your experiment.
NB: This is also true for flow cytometry! If you compare the MFIs of 1000 cells from each of 2 mice, you have n=1 per group.